

Python для аналізу даних: Matplotlib і візуалізація даних
Автор: Yasin TANIŞ

Вступ
Візуалізація даних — це використання графіків і діаграм, щоб складні набори даних стали зрозумілішими. Python пропонує кілька бібліотек для аналізу та візуалізації, і Matplotlib — одна з найпопулярніших. У цій статті ми розберемо основи візуалізації даних за допомогою Matplotlib.
Що таке Matplotlib
Matplotlib — потужна й гнучка бібліотека для побудови 2D-графіків у Python. Вона дає змогу будувати лінійні графіки, стовпчикові діаграми, точкові та багато інших видів графіків.
Встановлення Matplotlib
Перш ніж використовувати Matplotlib, його потрібно встановити. Якщо бібліотеки ще немає у вашій системі, встановіть її цією командою:
pip install matplotlibБазове використання
Почнімо з простого лінійного графіка.
import matplotlib.pyplot as plt
# Example data
x = [1, 2, 3, 4, 5]
y = [2, 3, 5, 7, 11]

# Creating a line plot
plt.plot(x, y)
plt.xlabel('X Axis')
plt.ylabel('Y Axis')
plt.title('Simple Line Plot')
plt.show()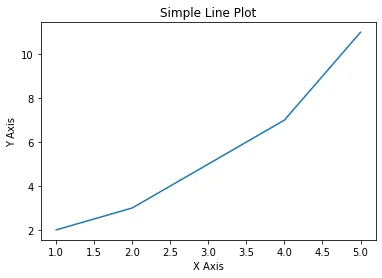
Цей простий приклад показує, як побудувати лінійний графік у Matplotlib. Тепер розгляньмо інші типи графіків і налаштування.
Типи графіків
Стовпчикові діаграми
Стовпчикові діаграми використовують для візуалізації категоріальних даних.
import matplotlib.pyplot as plt

# Example data
categories = ['A', 'B', 'C', 'D', 'E']
values = [4, 7, 1, 8, 5]
# Creating a bar chart
plt.bar(categories, values)
plt.xlabel('Categories')
plt.ylabel('Values')
plt.title('Simple Bar Chart')
plt.show()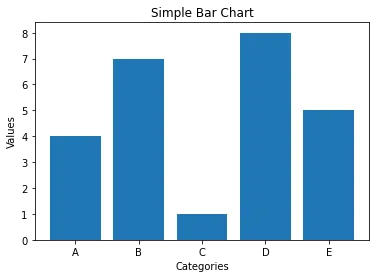
Точкові графіки
Точкові графіки показують зв’язок між двома змінними.
import matplotlib.pyplot as plt

# Example data
x = [5, 7, 8, 7, 2, 17, 2, 9, 4, 11]
y = [99, 86, 87, 88, 100, 86, 103, 87, 94, 78]
# Creating a scatter plot
plt.scatter(x, y)
plt.xlabel('X Variable')
plt.ylabel('Y Variable')
plt.title('Simple Scatter Plot')
plt.show()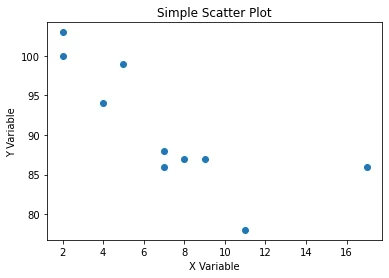
Гістограми
Гістограми показують, як розподілені дані.
import matplotlib.pyplot as plt

# Example data
data = [1, 2, 2, 3, 3, 3, 4, 4, 4, 4, 5, 5, 5, 5, 5]
# Creating a histogram
plt.hist(data, bins=5)
plt.xlabel('Values')
plt.ylabel('Frequency')
plt.title('Simple Histogram')
plt.show()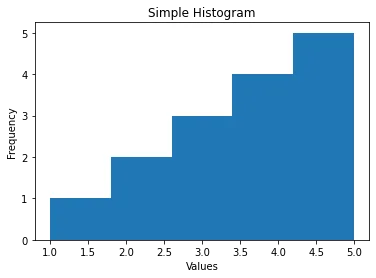
Кругові діаграми
Кругові діаграми показують частки категоріальних даних.
import matplotlib.pyplot as plt
# Example data
labels = ['A', 'B', 'C', 'D']
sizes = [15, 30, 45, 10]
# Creating a pie chart
plt.pie(sizes, labels=labels, autopct='%1.1f%%', startangle=90)
plt.axis('equal')  # Equal aspect ratio ensures that pie is drawn as a circle.
plt.title('Simple Pie Chart')
plt.show()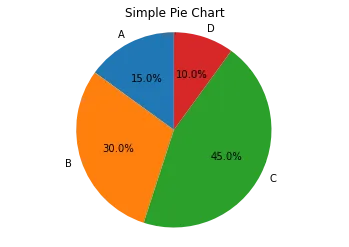
Налаштування графіків
Matplotlib має широкі можливості налаштування графіків, щоб вони легше читалися й приємніше виглядали.
Кольори та стилі
Щоб зробити графіки привабливішими, можна додати кольори та стилі.
import matplotlib.pyplot as plt

# Example data
x = [1, 2, 3, 4, 5]
y = [2, 3, 5, 7, 11]
# Customizing the line plot
plt.plot(x, y, color='red', linestyle='--', marker='o')
plt.xlabel('X Axis')
plt.ylabel('Y Axis')
plt.title('Customized Line Plot')
plt.show()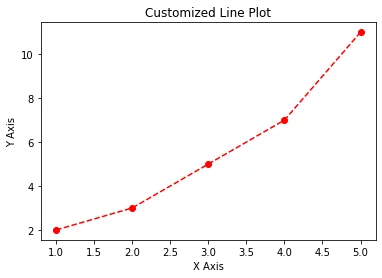
Розмір і роздільна здатність графіка
Розмір і роздільну здатність графіка можна підлаштувати під різні потреби.
import matplotlib.pyplot as plt

# Example data
x = [1, 2, 3, 4, 5]
y = [2, 3, 5, 7, 11]
# Setting plot size and resolution
plt.figure(figsize=(10, 5), dpi=100)
plt.plot(x, y)
plt.xlabel('X Axis')
plt.ylabel('Y Axis')
plt.title('Large and High-Resolution Plot')
plt.show()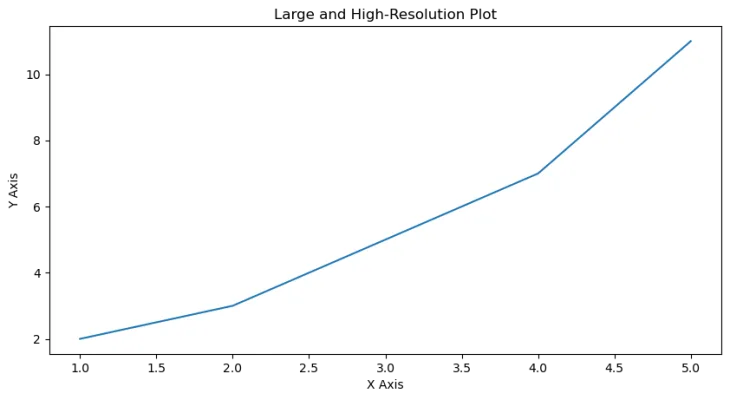
Підграфіки
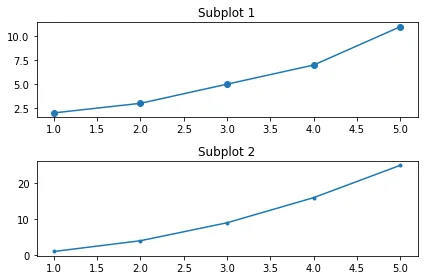
Підграфіки дають змогу розмістити кілька графіків на одному рисунку.
Логарифмічні графіки
Логарифмічні графіки корисні для даних, що охоплюють дуже широкий діапазон значень.
import matplotlib.pyplot as plt
import numpy as np

# Example data
x = np.linspace(0.1, 100, 100)
y = np.exp(x)
# Creating a logarithmic plot
plt.plot(x, y)
plt.xscale('log')
plt.yscale('log')
plt.xlabel('Log X Axis')
plt.ylabel('Log Y Axis')
plt.title('Logarithmic Plot')
plt.show()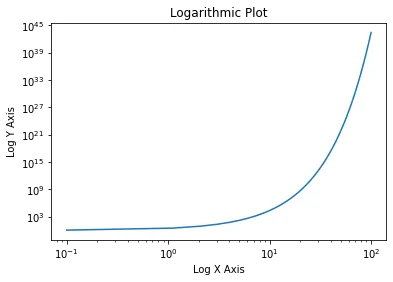
Розширене налаштування
Анотації
Анотації допомагають виділити окремі точки.
import matplotlib.pyplot as plt

# Example data
x = [1, 2, 3, 4, 5]
y = [2, 3, 5, 7, 11]
# Creating a plot with annotation
plt.plot(x, y)
plt.annotate('Important Point', xy=(3, 5), xytext=(4, 10),
             arrowprops=dict(facecolor='black', shrink=0.05))
plt.xlabel('X Axis')
plt.ylabel('Y Axis')
plt.title('Annotated Plot')
plt.show()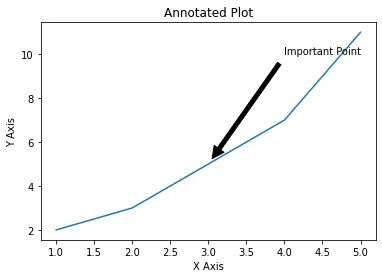
3D-графіки
Matplotlib уміє будувати й тривимірні графіки.
from mpl_toolkits.mplot3d import Axes3D
import matplotlib.pyplot as plt
import numpy as np

# Example data
x = np.linspace(-5, 5, 100)
y = np.linspace(-5, 5, 100)
x, y = np.meshgrid(x, y)
z = np.sin(np.sqrt(x**2 + y**2))
# Creating a 3D plot
fig = plt.figure()
ax = fig.add_subplot(111, projection='3d')
ax.plot_surface(x, y, z, cmap='viridis')
plt.title('3D Plot')
plt.show()


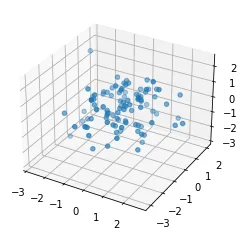
fig = plt.figure()
ax = fig.add_subplot(111, projection='3d')
x = np.random.standard_normal(100)
y = np.random.standard_normal(100)
z = np.random.standard_normal(100)
ax.scatter(x, y, z)
plt.show()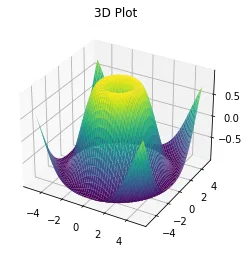
Приклад із синтетичними даними
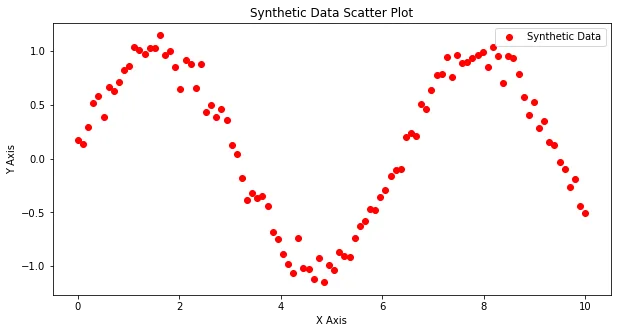
Щоб показати Matplotlib у дії, створімо синтетичний набір даних і візуалізуймо його різними типами графіків.
import numpy as np
import matplotlib.pyplot as plt

# Generating synthetic data
np.random.seed(0)
x = np.linspace(0, 10, 100)
y = np.sin(x) + np.random.normal(0, 0.1, 100)
# Line plot
plt.figure(figsize=(10, 5))
plt.plot(x, y, label='Synthetic Data')
plt.xlabel('X Axis')
plt.ylabel('Y Axis')
plt.title('Synthetic Data Line Plot')
plt.legend()
plt.show()
# Scatter plot
plt.figure(figsize=(10, 5))
plt.scatter(x, y, label='Synthetic Data', color='red')
plt.xlabel('X Axis')
plt.ylabel('Y Axis')
plt.title('Synthetic Data Scatter Plot')
plt.legend()
plt.show()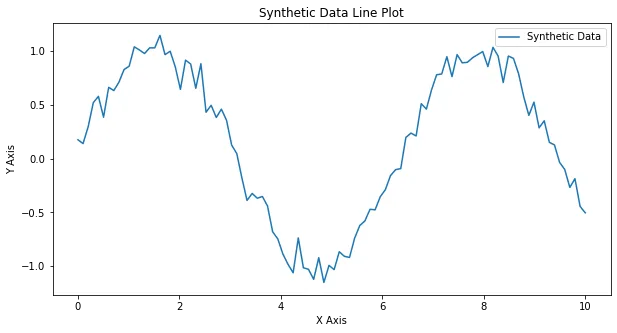
Висновок
Matplotlib — потужний і гнучкий інструмент візуалізації даних у Python. У цій статті ми побудували лінійні, стовпчикові й точкові графіки, гістограми, кругові діаграми та багато іншого. Ми також налаштували графіки й створили складніші візуалізації: графіки з анотаціями, підграфіки, логарифмічні та 3D-графіки. Використовуючи широкі можливості Matplotlib, ви зможете розвинути навички візуалізації та подавати дані ясно й переконливо.
Джерела
- Hunter, J. D. (2007). Matplotlib: A 2D Graphics Environment. Computing in Science & Engineering, 9(3), 90–95.
- Документація Matplotlib: matplotlib.org
- Waskom, M. та ін. (2021). Seaborn: Statistical Data Visualization. Journal of Open Source Software, 6(60), 3021. seaborn.pydata.org